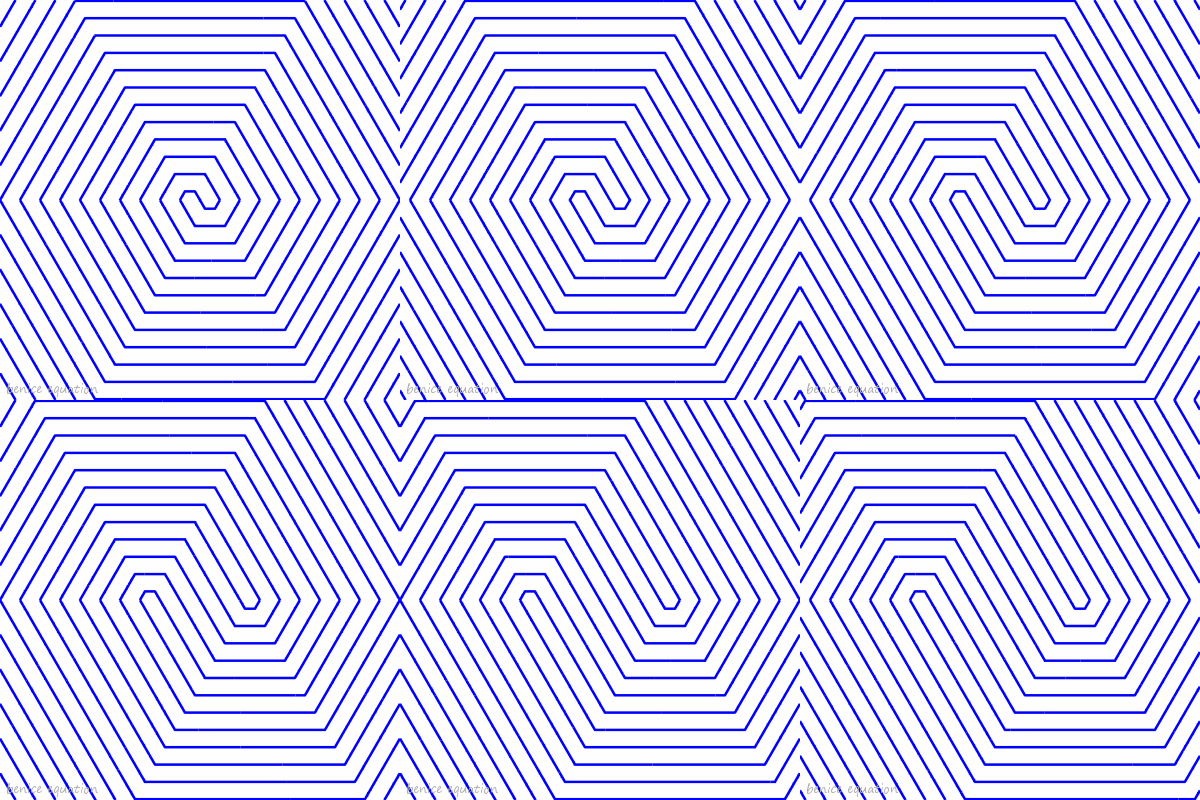
Equations: sin(π sqrt((x + k sgn(y)/2)² + y²)) = 0
k = 1, 2, 3, ..., 8
Equations: cos(π sqrt((x + k sgn(y)/2)² + y²)) = 0
k = 1, 2, 3, ..., 8
Square Spirals (spirals made of half-squares):
Equations: sin(π(abs(x + k sgn(y)/2) + abs(y))) = 0
k = 1, 2, 3, 4
Equations: cos(π(abs(x + k sgn(y)/2) + abs(y))) = 0
k = 1, 2, 3, 4
Regular Polygon Spirals (spirals made of regular semi-polygons):
Equations: sin(π p(x + k sgn(y)/2, y)) = 0
k = 1, 2, 3, ..., 8
p(x,y) = sqrt(x² + y²) sec(π/n) cos(mod(arctan(y/x),2π/n) - π/n)
n = 6
Equations:cos(π p(x + k sgn(y)/2, y)) = 0
k = 1, 2, 3, ..., 8
p(x,y) = sqrt(x² + y²) sec(π/n) cos(mod(arctan(y/x),2π/n) - π/n)
n = 6
( Mathematical softwares used: Graph, gnuplot )


Hi Benice! I love this blog, the art here is amazing. I just recently built a polargraph style window plotter and I'm setting it up so that it uses gnuplot to do it's drawing.
ReplyDeleteI'm kind of a gnuplot newbie though and I'm having a little trouble translating your equations into gnuplot scripts. Would you mind sharing the full gnuplot script for one of these?
Hi,
ReplyDeleteHere are two scripts for the circle spirals:
script 1:
k = 2.0
# If k is even:
g(x,y) = cos(pi*sqrt((x + k*sgn(y)/2)**2 + y**2))
# If k is odd:
# g(x,y) = cos(pi*sqrt((x + k*sgn(y)/2)**2 + y**2)) / y
set xrange [-10:10]
set yrange [-10:10]
set samples 256
set isosamples 256
set contour base
set cntrparam levels discrete 0.0
unset surface
set table "g.dat"
splot g(x,y)
unset table
set size ratio -1
unset key
plot "g.dat" w l lw 1 lc rgb "red"
Note for script 1:
gnuplot gives wrong graph (on the x-axis) for the sin case.
script 2:
k = 1.0
f_upper(x,y) = sin(pi*sqrt((x + k/2)**2 + y**2))
f_lower(x,y) = sin(pi*sqrt((x - k/2)**2 + y**2))
set xrange [-10:10]
set samples 256
set isosamples 256
set contour base
set cntrparam levels discrete 0.0
unset surface
set yrange [0:10]
set table "f_upper.dat"
splot f_upper(x,y)
unset table
set yrange [-10:0]
set table "f_lower.dat"
splot f_lower(x,y)
unset table
set yrange [-10:10]
set size ratio -1
unset key
plot "f_upper.dat" w l lw 1 lc rgb "red", \
"f_lower.dat" w l lw 1 lc rgb "red"